
What Is a Gantt Chart in Project Management?
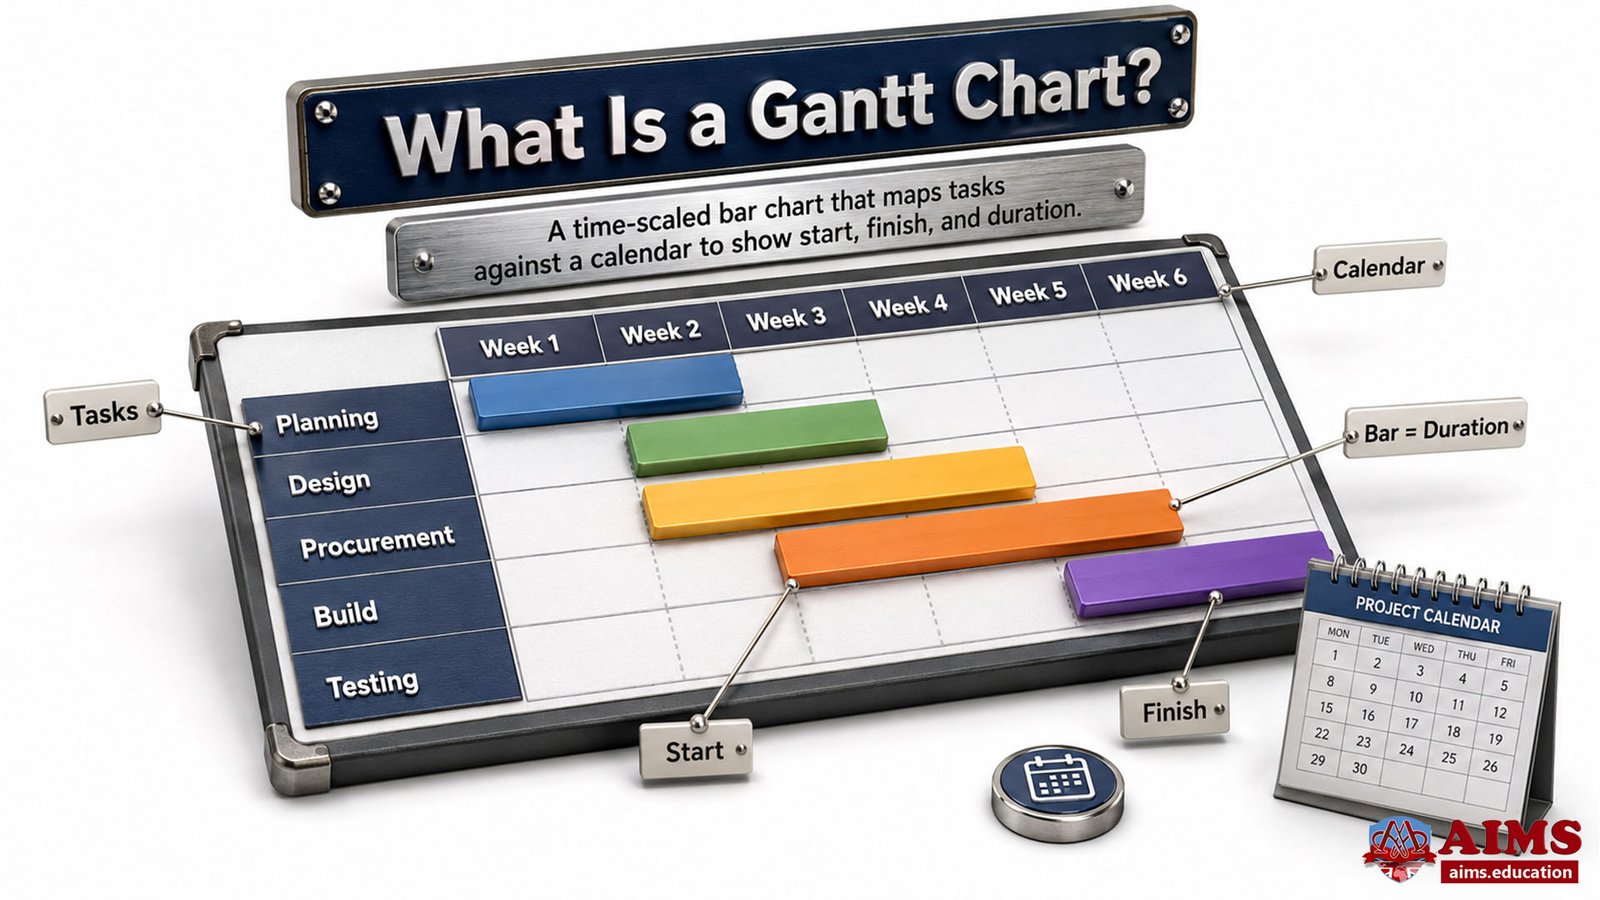
A Gantt chart in project management is a time-scaled bar chart that plots project tasks against a calendar, using horizontal bars to show when each activity starts, finishes, and how long it lasts. It helps project managers build and communicate the project schedule, visualize dependencies and milestones, coordinate overlapping work, and monitor progress against planned dates.
- In practice, a project management Gantt chart turns schedule information into a visual plan that team members and stakeholders can understand quickly.
- It is especially useful when a project contains multiple activities that overlap, depend on one another, or must reach defined milestones by specific dates.
- A Gantt chart is more than a basic timeline because it can also represent sequencing, relationships, ownership, progress, and schedule status.
How Does a Gantt Chart Work?
- A Gantt chart is a visual representation of a project schedule in which activities appear vertically and time appears horizontally.
- Each activity is represented by a bar whose position shows its planned start and finish dates and whose length shows its duration.
- Depending on the scheduling tool, the chart can also display task relationships, milestones, assigned resources, progress, baselines, and the critical path.
The Gantt Chart should not be confused with the scheduling calculations behind it. The Gantt view presents the schedule visually, while scheduling logic, calendars, activity durations, constraints, and dependencies determine the dates shown on that view. For this reason, a Gantt chart is best understood as a schedule visualization and control tool, not as a complete scheduling method by itself.
History of the Gantt Chart
Henry L. Gantt is closely associated with the development and popularization of time-scaled bar charts in the early twentieth century. The basic idea remains recognizable today: work is plotted against time so managers can compare what was planned with what is happening. Modern software has extended the concept by adding dependencies, milestones, baselines, resource assignments, progress indicators, filters, and automated schedule updates.

What Is the Main Purpose of a Gantt Chart?
The main purpose of a Gantt chart is to make the project schedule visible, understandable, and manageable. It allows the project manager to see what work must occur, when it should occur, which activities can overlap, and which tasks depend on earlier work.
A well-maintained Gantt chart project schedule supports several practical needs:
- It shows planned start dates, finish dates, and durations for project activities.
- It communicates the sequence of work to team members and stakeholders.
- It highlights important milestones and delivery dates.
- It helps identify activities that can run in parallel and those that must wait for predecessors.
- It provides a visual basis for comparing planned dates with actual progress.
- It helps project managers recognize the schedule impact of approved changes or delays.
For a broader understanding of how project activities are planned and controlled against time, see AIMS’ guide to project time management techniques and schedule control.
Two Main Parts of a Gantt Chart
A typical Gantt chart has two main parts: a task grid and a time-scaled timeline. These two views work together so that descriptive schedule data on the left corresponds directly with visual task bars on the right.
- Task grid: The grid contains the structured information used to describe and organize project activities.
- Timeline: The timeline plots those activities against dates so their timing and relationships can be seen visually.
1. Gantt Chart Grid
The grid normally appears on the left side of the chart. It lists information such as task names, start and finish dates, durations, predecessors, progress, and assigned owners or resources. The exact fields depend on the project and the software being used.
The grid is important because the quality of the visual schedule depends on the quality of the information entered. If task durations, dependencies, calendars, or progress data are inaccurate, the timeline may look precise while still representing an unrealistic plan.
2. Gantt Chart Timeline
The timeline normally appears on the right side. Each task is represented by a horizontal bar positioned between its scheduled start and finish dates. A longer bar usually represents a longer duration, while overlapping bars show work that is planned to occur at the same time.
Milestones may appear as symbols rather than bars because they usually represent significant points or events with zero duration. Dependency lines can connect activities to show sequencing relationships, while progress shading or status indicators can show how much work has been completed.
Gantt Chart Components and Their Functions
The core components of a Gantt chart are the task list, time scale, activity bars, dates, durations, dependencies, milestones, and progress information. Resource assignments, baselines, and critical-path highlighting are commonly added when the project requires more detailed schedule control.
| COMPONENT | FUNCTION IN THE GANTT CHART |
|---|---|
| Task or Activity List | Identifies the work that must be scheduled and tracked. |
| Time Scale | Shows the calendar across days, weeks, months, or another suitable planning interval. |
| Task Bars | Show when activities start and finish and visually represent their duration. |
| Dependencies | Show logical relationships between activities, such as one task needing to finish before another can start. |
| Milestones | Mark significant events, approvals, handoffs, or deliverables in the schedule. |
| Progress | Shows the reported completion status of activities when the schedule is updated. |
| Resources or Owners | Indicate who is responsible for or assigned to scheduled work when resource information is included. |
| Baseline | Provides an approved schedule reference against which current dates can be compared. |
| Critical Path Highlighting | Identifies critical activities when the underlying schedule has been logically linked and critical-path calculations are available. |
A Responsibility Assignment Matrix or estimating worksheet can support schedule development, but neither is a fundamental component of the Gantt chart itself. A RAM clarifies responsibility, while estimating documentation supports the assumptions and calculations used to develop realistic durations.
How Does a Gantt Chart Work?
A Gantt chart works by converting project activity data into a time-based visual schedule. Tasks are defined, given durations and dates, connected through logical relationships, and then displayed as horizontal bars across the project calendar.
- The project team identifies the activities needed to produce the required deliverables.
- Each activity receives a duration or effort estimate and, where appropriate, assigned resources.
- Dependencies establish which tasks must precede, follow, or overlap other tasks.
- The schedule engine calculates or records planned start and finish dates according to project logic and constraints.
- The Gantt view plots each task against time and displays milestones at important decision or completion points.
- During execution, actual dates, remaining durations, and completion information are updated so the current plan can be compared with the approved baseline.
This explains how does a Gantt chart work in practice: the chart does not create sound schedule logic automatically. It visualizes the result of the planning assumptions and relationships entered by the project team.
How to Create a Gantt Chart for a Project
To create a Gantt chart, define the project work, sequence the activities, estimate durations, assign dates and dependencies, mark milestones, and then plot the resulting schedule against time. The chart should be detailed enough to support control without becoming so granular that routine updating becomes difficult.
- Define the project scope and deliverables. Start by clarifying what the project must produce and what work is included.
- Break deliverables into manageable work. A work breakdown structure for defining project work can help organize the scope before individual schedule activities are developed.
- List and sequence the activities. Identify logical relationships between tasks. A project network diagram for activity sequencing is particularly useful when dependencies are complex.
- Estimate activity durations. Use realistic information about effort, resource availability, calendars, constraints, and uncertainty.
- Set dependencies, dates, and milestones. Connect related tasks and place key approvals, handoffs, or delivery events on the schedule.
- Review the critical path and schedule feasibility. Where the schedule is logically linked, use critical path analysis for project scheduling to understand which activities have the greatest influence on the project finish date.
- Baseline and update the schedule. Once approved, save the schedule baseline and update actual progress at agreed reporting intervals or whenever approved changes materially affect the plan.
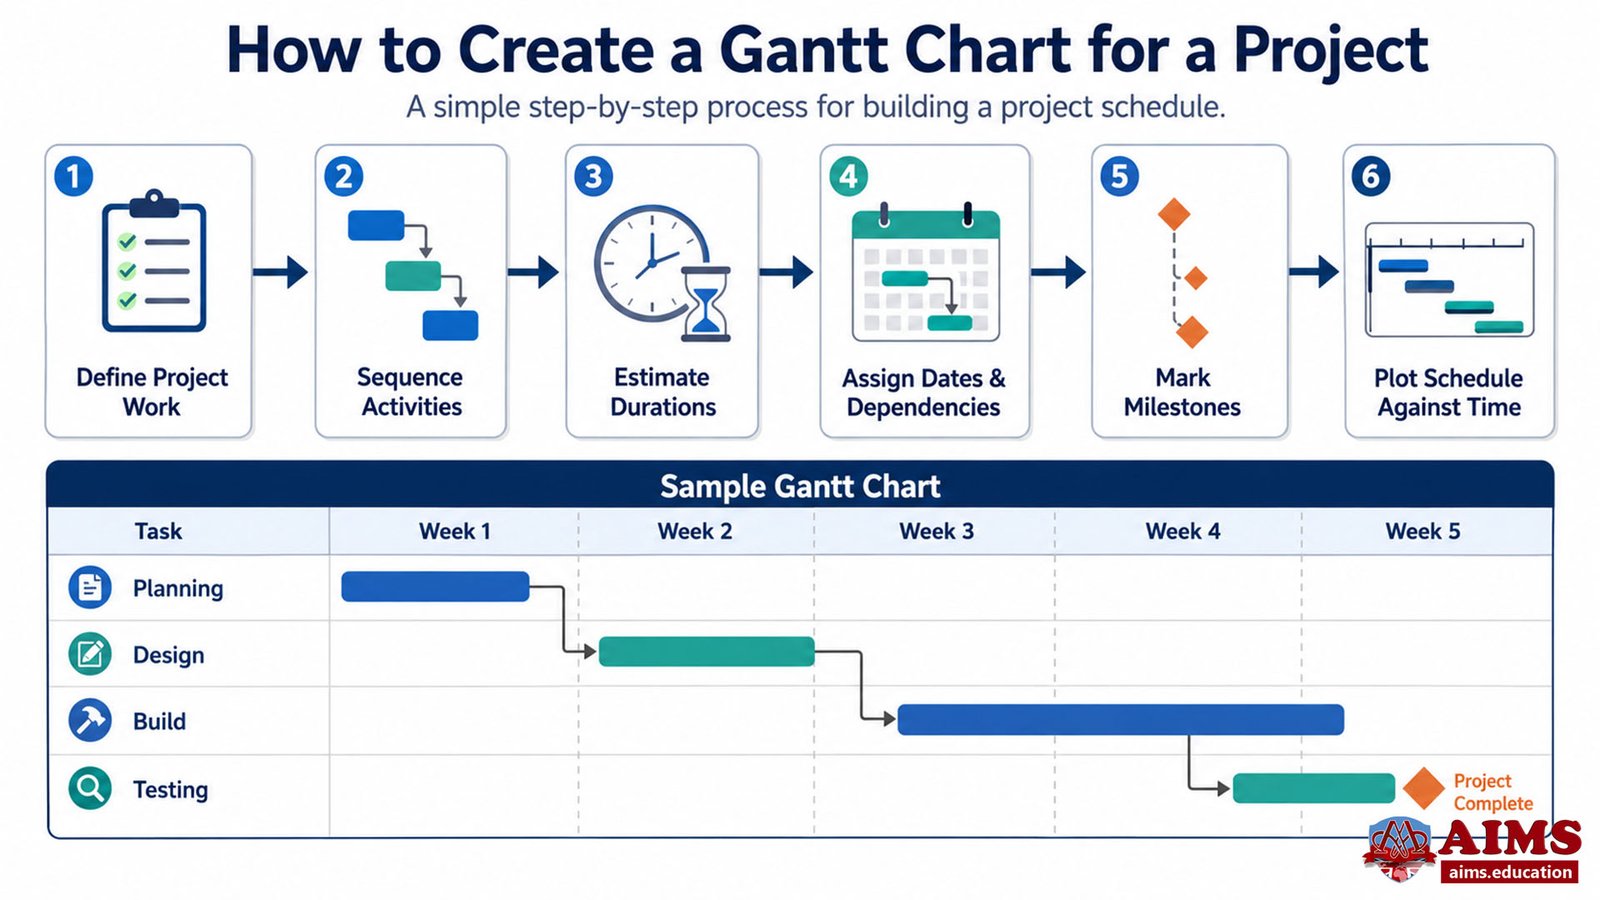
An existing Gantt chart template can save formatting time, but it cannot replace scope definition, realistic estimating, dependency logic, or schedule review. These planning decisions determine whether the chart represents an achievable project plan.
Gantt Chart Example in Project Management
A simple Gantt chart example can show how tasks, dates, overlaps, dependencies, and milestones work together in one schedule. Consider a small company preparing a new website launch. The project contains six activities followed by one launch milestone.
| ACTIVITY | START | FINISH | DEPENDENCY |
|---|---|---|---|
| 1. Confirm Requirements | 1 September | 3 September | None |
| 2. Design Page Layouts | 4 September | 9 September | After Activity 1 |
| 3. Prepare Website Content | 4 September | 8 September | After Activity 1 |
| 4. Develop Website | 10 September | 18 September | After Activity 2 |
| 5. Upload and Review Content | 19 September | 22 September | After Activities 3 and 4 |
| 6. Test and Correct Issues | 23 September | 26 September | After Activity 5 |
| Milestone: Website Launch | 27 September | 27 September | After Activity 6 |
The Gantt view would make the schedule logic visible in several ways:
- Activities 2 and 3 overlap because design and content preparation can begin after the requirements are confirmed.
- Activity 4 cannot begin until the design work is completed.
- Activity 5 waits for both the content and website development work to be ready.
- The launch milestone occurs only after testing and correction are complete.
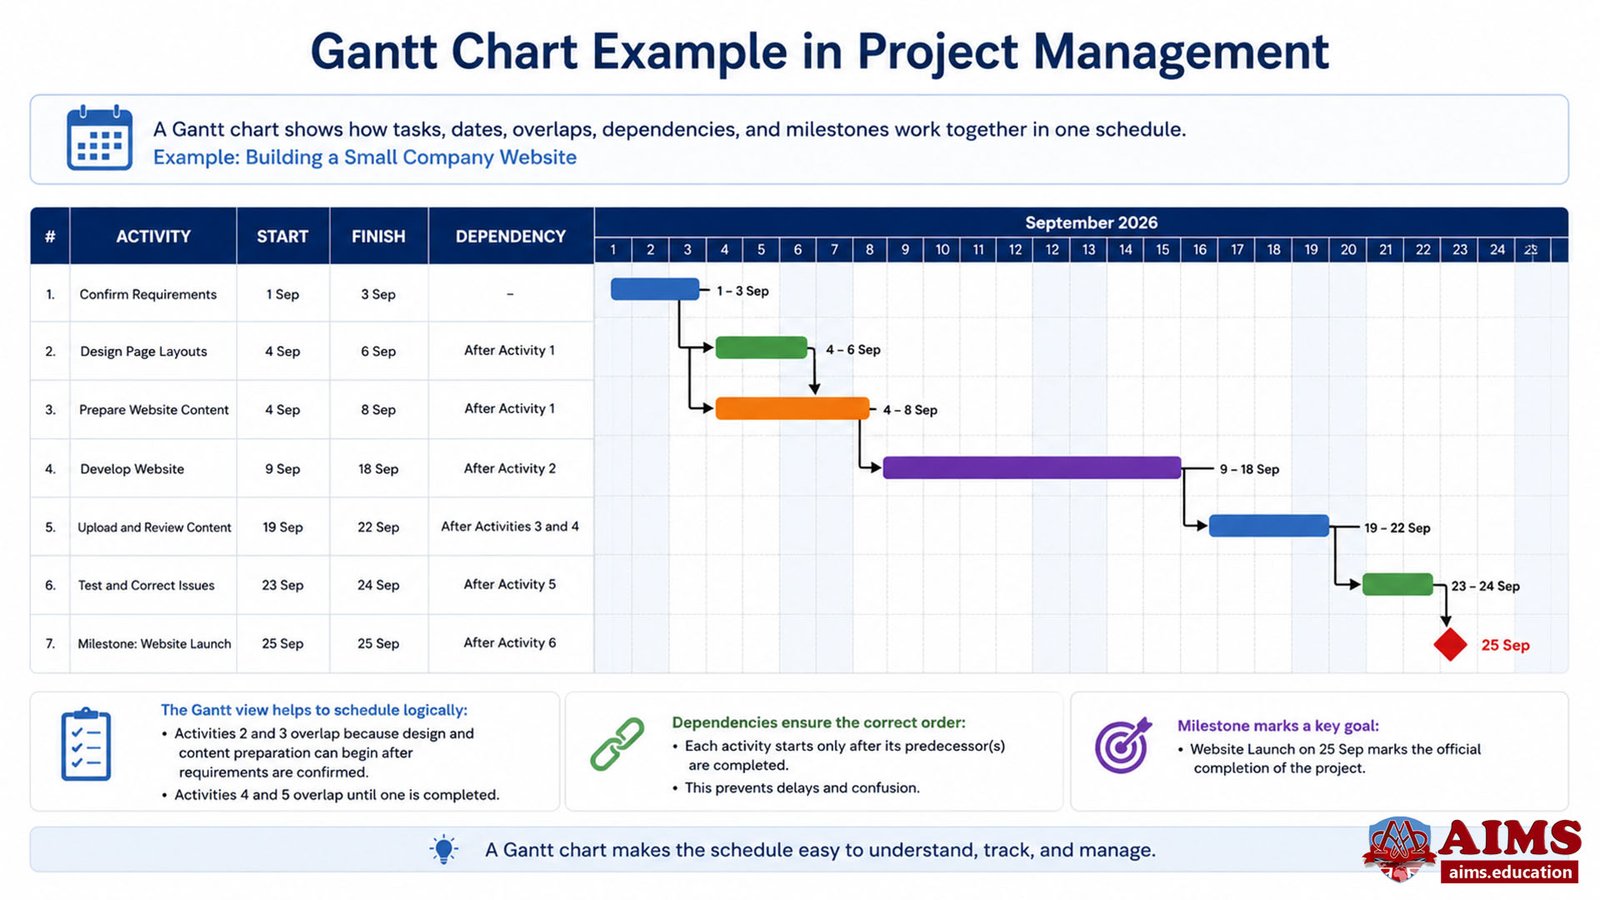
This visual sequencing helps the team coordinate parallel work while protecting the activities that determine the final delivery date.
Gantt Chart Dependencies, Milestones, and Critical Path
Dependencies show how activities are logically related, milestones mark significant schedule events, and the critical path identifies the sequence of activities that governs the project’s earliest completion date. These concepts make a Gantt chart more informative than a simple list of dates.
Gantt Chart Dependencies
Gantt chart dependencies connect activities so that a change to one task can reveal an effect on later work. A common relationship is finish-to-start, where the successor cannot begin until its predecessor is finished. Scheduling software may also support other relationship types when the project logic requires them.
Milestones
Milestones represent significant events such as an approval, phase completion, contractual date, product release, or client acceptance. Because they normally have zero duration, they are displayed as markers rather than long activity bars.
Gantt Chart Critical Path
Gantt chart critical path highlighting can help managers see which scheduled activities require the closest timing attention. However, the chart can show a meaningful critical path only when the underlying activities have realistic durations and are logically connected. The critical path comes from schedule-network calculations; the Gantt chart presents the result visually.
Gantt Chart in Agile and Waterfall Project Management
Gantt charts can support predictive, adaptive, and hybrid environments, but the level of detail and purpose of the chart should match the way the project is managed. Their strongest traditional use is detailed time-based scheduling, while agile teams often use them at a higher level for releases, cross-team dependencies, milestones, and roadmap visibility.
Gantt Chart in Waterfall Planning
In a predictive or waterfall environment, work is commonly planned through defined phases and activity sequences. A Gantt chart fits this approach well because it can display detailed task timing, dependencies, milestones, baselines, and progress across the planned life cycle.
Gantt Chart in Agile Planning
In agile environments, detailed daily work is usually managed through iteration-focused tools such as backlogs and boards. A Gantt chart can still add value when managers need to communicate high-level delivery dates, release windows, cross-team dependencies, or external milestones.
The practical choice depends on the delivery environment. AIMS’ comparison of Agile, Waterfall, and Hybrid project approaches explains why project planning tools should support the chosen way of working rather than dictate it.
Gantt Chart vs Timeline vs PERT Chart
A Gantt chart, project timeline, and PERT chart all communicate project information, but they emphasize different aspects of planning. A Gantt chart focuses on activities against time, a project timeline provides a simpler chronological overview, and a PERT chart emphasizes activity relationships and network logic.
| COMPARISON AREA | GANTT CHART | PROJECT TIMELINE | PERT CHART |
|---|---|---|---|
| Primary Focus | Tasks, durations, dates, and schedule status. | Key events and milestones in chronological order. | Activity relationships, sequencing, and network logic. |
| Typical Visual Form | Horizontal bars plotted against time. | Simplified line or chronological sequence of events. | Network of connected nodes or activities. |
| Task Duration | Clearly visible through bar length and dates. | Often simplified or omitted. | Used in schedule analysis but not represented as time-scaled bars. |
| Dependencies | Can be shown with connecting lines between tasks. | Usually limited or not emphasized. | Central to the diagram. |
| Best Use | Planning, communicating, and monitoring the project schedule. | Executive or stakeholder overview of important dates. | Analyzing sequencing, dependencies, and schedule paths. |
This distinction is useful when considering Gantt chart vs timeline or Gantt chart vs PERT chart. The tools are not necessarily substitutes. A complex project may use a network diagram to validate logic, a Gantt chart to communicate and control dates, and a high-level timeline for executive reporting.
Gantt Chart vs Person Loading Chart
A Gantt chart and a person loading chart are related but different. The Gantt chart answers, “What work is scheduled, and when?” A person loading or resource loading chart answers, “Who is assigned, and how much work has been allocated?” Using both views can help a manager compare schedule demand with available capacity.
Benefits and Applications of Gantt Charts in Project Management
The main benefits of Gantt charts are schedule visibility, coordination, dependency awareness, milestone tracking, and clearer communication. Their value comes from presenting complex schedule information in a format that can be reviewed quickly by managers, team members, clients, and other stakeholders.
- Schedule tasks over time. Project activities can be positioned across the planned calendar to show start dates, finish dates, durations, and overlaps.
- Coordinate dependent work. Managers can see when one activity must wait for another and identify where sequencing problems may affect later tasks.
- Track progress. Updated task status can be compared with planned dates and the approved baseline to reveal schedule slippage or changes in expected completion.
- Communicate milestones. Key approvals, handoffs, deliverables, and completion points can be made visible to stakeholders.
- Support resource discussions. Resource assignments can be displayed alongside schedule activities, helping managers identify obvious overlaps or potential conflicts, although dedicated resource-loading analysis may still be required.
- Assess the effect of change. When an approved change affects durations, dependencies, or dates, an updated Gantt chart can show the resulting schedule impact.
- Support project control. The chart can provide a common visual reference for schedule reviews, status meetings, forecasting discussions, and corrective action.
Project managers should remember that reported task completion is not the same as schedule performance. Where cost and schedule performance need to be measured together, earned value management for project performance analysis provides a stronger quantitative framework than a progress bar alone.
Advantages and Disadvantages of Gantt Charts
Gantt charts are powerful communication and scheduling views, but their usefulness depends on the quality of the underlying schedule and the level of complexity being managed. They work best when they are kept current and supported by appropriate network, resource, risk, and performance analysis.
Advantages of Gantt Charts
- Clear visual representation: Stakeholders can quickly see the timing and sequence of planned work.
- Task organization: The chart presents multiple project activities within one structured schedule view.
- Improved coordination: Dependencies and overlaps help teams understand how their work connects with other activities.
- Progress visibility: Current activity status can be displayed against planned dates when the schedule is maintained properly.
- Milestone visibility: Major approvals, deadlines, and delivery points are easy to identify.
- Change visibility: Revised dates can make the schedule consequences of approved changes easier to communicate.
Disadvantages and Limitations of Gantt Charts
- Large schedules can become difficult to read. Hundreds or thousands of activities, dependency lines, and milestones can overwhelm a single view.
- A Gantt chart can create false confidence if the schedule logic is weak. Attractive bars do not prove that durations, dependencies, or resource assumptions are realistic.
- Resource capacity is not fully explained by task bars. A separate resource-loading or capacity view may be necessary to identify over-allocation accurately.
- Updates require discipline. If actual dates, remaining work, approved changes, and forecast dates are not maintained, the chart quickly becomes outdated.
- Progress bars can be misunderstood. Percentage complete may show how much of an activity is reported as done, but it does not automatically show whether the overall project is ahead of or behind its planned performance.
Modern project-management software can reduce some traditional limitations through automated updates, shared access, filters, collaboration, and linked resource data. However, software features do not eliminate the need for sound scheduling judgment.
Common Gantt Chart Mistakes to Avoid
The most common Gantt chart mistakes occur when teams focus on drawing bars rather than building and maintaining a credible schedule. A visually polished chart is useful only when its underlying activity data reflects the real project.
- Avoid creating tasks without meaningful dependencies when sequencing relationships actually exist.
- Avoid using unrealistic durations simply to fit a preferred completion date.
- Avoid treating every task as equally important when some activities have much less schedule flexibility than others.
- Avoid placing excessive detail on the chart if it makes reporting and updating unmanageable.
- Avoid confusing percentage complete with proof that the project is on schedule.
- Avoid leaving the chart unchanged after approved scope, estimate, risk, or schedule changes materially affect the plan.
Professional Relevance of Gantt Chart Skills
Understanding how to use a Gantt chart is a practical project-management skill because scheduling decisions affect coordination, resource timing, stakeholder expectations, and delivery control. Professionals who want structured development in these areas can explore AIMS’ Certified Project Manager (CPM) with PMP training, online project management diploma – globally accredited and recognized, or career-focused online MBA in Project Management.
Final Words
A Gantt chart remains one of the clearest ways to communicate a project schedule because it connects work with time. Used properly, it can show tasks, dates, durations, overlaps, dependencies, milestones, progress, and critical activities in one visual view. Its real value, however, depends on credible planning information and disciplined updates. The chart should support project judgment, not replace it.
Frequently Asked Questions
What is a Gantt chart in project management?
A Gantt chart is a time-scaled bar chart used to display project activities against a calendar. It normally shows task start and finish dates, durations, and may also show dependencies, milestones, progress, resources, baselines, and the critical path.
What is the main purpose of a Gantt chart?
The main purpose is to make the project schedule easy to plan, communicate, and monitor. It helps managers and stakeholders see what work is scheduled, when it should occur, which tasks overlap, and how activities depend on one another.
How does a Gantt chart work?
A Gantt chart plots project tasks vertically and time horizontally. Each task appears as a bar positioned between its scheduled start and finish dates, while connecting lines, milestone markers, and progress indicators can provide additional schedule information.
What are the main components of a Gantt chart?
The main components are the task list, time scale, task bars, start and finish dates, durations, dependencies, milestones, and progress information. Many project-management tools also display owners, resources, baselines, and critical-path information.
How do you create a Gantt chart for a project?
Define the project scope, break deliverables into activities, sequence the work, estimate durations, set dependencies and milestones, assign planned dates, and plot the activities against time. Review schedule logic before baselining the plan, then update actual progress throughout execution.
What are the advantages and disadvantages of Gantt charts?
Advantages include clear schedule visualization, coordination, dependency awareness, milestone visibility, and progress communication. Limitations include reduced readability on very large projects, ongoing update requirements, limited resource-capacity analysis, and the risk of presenting a weak underlying schedule as if it were reliable.
What is the difference between a Gantt chart and a project timeline?
A Gantt chart normally provides task-level scheduling detail, including durations and dependencies. A project timeline is usually a simpler chronological view designed to communicate major dates, events, phases, or milestones.
What is the difference between a Gantt chart and a PERT chart?
A Gantt chart emphasizes activities against calendar time, while a PERT chart emphasizes activity relationships and network logic. They can complement each other because the network can support schedule analysis while the Gantt view communicates timing more directly.
Can a Gantt chart show the critical path?
Yes. Scheduling software can highlight critical-path activities on a Gantt chart when the underlying schedule contains appropriate durations, dependencies, calendars, and network calculations. The Gantt chart displays the critical path visually rather than calculating it simply from bar length.
When should a project manager use a Gantt chart?
A project manager should use a Gantt chart when the team needs a time-based view of tasks, milestones, dependencies, overlaps, deadlines, or progress. It is particularly useful for communicating schedule information across teams and stakeholders.
AIMS Project Management Academy: Practice-Focused Project Education
Since 2005, AIMS’ Project Management Academy has supported a global learner community through internationally standardized, career-focused education, qualified faculty, industry-oriented teaching, practical skill development, 3D interactive learning content, and real-world case-study-based qualifications. AIMS holds international accreditations and develops its educational content, study materials, and curriculum collaboratively, with rigorous peer review by an academic board of qualified industry practitioners. Schedule visualization and control are core professional competencies for effective project delivery. Explore practical and flexible project management qualifications.