What is Logistic Regression?
Logistic regression, also known as the logit model, is a statistical method used to predict one of the two possible outcomes (such as yes or no) when the dependent variable is binary (typically coded as 0 or 1). It models the relationship between one or more independent variables (which can be nominal, ordinal, interval, or ratio-level) and the binary outcome.
In machine learning, logistic regression formula is considered a supervised learning algorithm that performs binary classification. It predicts two possible outcomes, such as 0/1, yes/no, or true/false, where 0 indicates a negative class and 1 indicates a positive class.
Logistic Regression Example
A logistics company uses a logistic regression model to classify whether a package will be delivered on time “1” or delayed “0”, based on known factors.

How Businesses Use Logistic Regression R
Organizations use the logistic regression model to extract insights from historical data and perform predictive analysis. By applying logistic regression in R or other platforms, businesses can:
- Improve decision-making,
- Boost operational efficiency, and
- Reduce costs.
What is the Logistic Regression Formula?
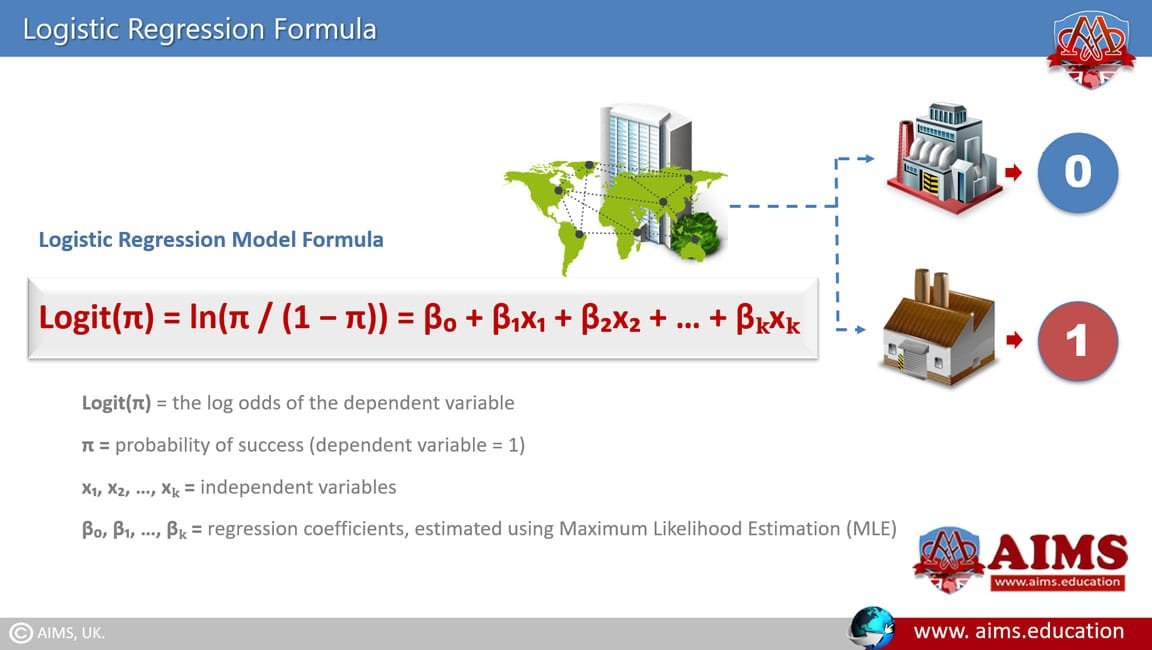
Logistic regression involves a logit transformation, which is based on log odds—the natural logarithm of the odds ratio. Odds are defined as the probability of success divided by the probability of failure. The general logistic regression formula for the model is:
Logit(π) = ln(π / (1 − π)) = β₀ + β₁x₁ + β₂x₂ + … + βₖxₖ
Where,
- Logit(π) = the log odds of the dependent variable
- π = probability of success (dependent variable = 1)
- x₁, x₂, …, xₖ = independent variables
- β₀, β₁, …, βₖ = regression coefficients, estimated using Maximum Likelihood Estimation (MLE)
For binary classification using the logistic regression model, predictions are interpreted as:
- Probability < 0.5 → predicted class is 0
- Probability ≥ 0.5 → predicted class is 1
This threshold can be adjusted based on the business requirement or model performance metrics.
Assumptions of Logistic Regression
The following assumptions must be satisfied when applying a logistic regression model:
- The dependent variable is binary (e.g., 0/1, yes/no, true/false).
- There is a linear relationship between the logit of the outcome and the predictor variables.
- No extreme outliers should be present in the continuous independent variables.
- There must be no multicollinearity (high correlation) among the independent variables.
Decision Boundary in Logistic Regression
In this model, the decision boundary is formed based on the logit function applied to a linear combination of input features. It represents the threshold at which a predicted probability switches classes, typically when the probability equals 0.5. This is the point at which the model is equally likely to classify the case as positive or negative.
For a binary logistic regression model with two predictors, the decision boundary is defined by:
0 = β₀ + β₁x₁ + β₂x₂
Where:
- β₀, β₁, β₂ are model coefficients
- x₁, x₂ are the independent variables
This answers the question: How do we find a decision boundary for logistic regression? The boundary can be linear or nonlinear, depending on the model and transformation of input variables.
Key Properties of the Logistic Regression Equation
Important characteristics of the logistic regression formula include:
- The dependent variable follows a Bernoulli distribution, meaning it can take on only two values: 0 or 1.
- Predictions are made based on the Maximum Likelihood Estimation (MLE) technique, which finds parameters that maximize the probability of observing the given data.
- Unlike linear regression, logistic regression does not use R² (coefficient of determination). Instead, it is often evaluated using metrics like AUC, concordance, log-likelihood, and accuracy.

Logistics Regression Example
Predicting On-Time Delivery at DHL Express
1. Background and Objective
- DHL Express, a global leader in logistics, wanted to predict whether an international package would be delivered on time using logistic regression.
- The goal was to reduce late deliveries and optimize logistics operations.
- To use logistic regression to classify whether a package will be delivered on time (1) or delayed (0) based on known independent variables at the time of shipping.
2. Dataset
DHL collected 50,000 international shipping records and used the following variables:
| Variable | Description | Type |
| Package Weight | Total weight of the shipment in kilograms | Continuous |
| Shipping Distance | Distance in kilometers from the origin to the destination | Continuous |
| Shipping Mode | Type of shipping: Air, Sea, or Road | Categorical |
| Customs Delay | Whether the shipment faced a customs delay | Binary (0 = No, 1 = Yes) |
| Delivered On Time | Outcome: Was the package delivered on time? | Binary (0 = No, 1 = Yes) |
3. Model Output
The regression model estimated the following coefficients
| Variable | Coefficient | Interpretation |
| Intercept | -1.75 | Baseline log-odds of on-time delivery without other variables |
| Package Weight | -0.08 | Heavier packages slightly reduce the likelihood of on-time delivery |
| Shipping Distance | -0.002 | Longer distances marginally reduce the chances of on-time delivery |
| Shipping Mode (Air) | 1.20 | Air shipping significantly increases the odds of on-time delivery |
| Customs Delay | -2.10 | Shipments delayed at customs are much less likely to arrive on time |
4. Interpretation
a. Distance and Package Weight
Negative coefficients indicate that longer distances and heavier packages reduce the chance of on-time delivery.
- Weather Condition: Worse weather (rain or snow) significantly increases delay probability.
- Customs Clearance: Every additional hour in customs lowers the odds of being on time.
- Shipping Mode: Road transport is less reliable compared to air.
b. Prediction Example
A shipment from London to Karachi has the following data:
- Distance = 7,200 km
- Weight = 12 kg
- Weather = Rain (1)
- Customs Time = 4 hours
- Shipping Mode = Air (0)
After applying the above values in the logistic regression formula, we may calculate that:
- Logit = 1.75 + (-0.003 × 7200) + (-0.02 × 12) + (-0.65 × 1) + (-0.08 × 4) + (-0.5 × 0) = -21.07
- Probability (p) ≈ 0.0000000069
So, very low chance of on-time delivery in this case due to long distance, poor weather, and customs delay.
5. Result
Here is the impact of using the formula at DHL
- Improved on-time delivery prediction accuracy by 15%.
- Enabled automated risk alerts for packages likely to be delayed.
- Informed route planning and resource allocation.
- Used as part of AIMS Supply Chain Analytics curriculum as a real-world case study.

Linear Regression vs Logistic Regression
Linear regression and logistic regression are both widely used models in data science and machine learning.
1. Linear Regression Model
A linear regression model is used when the dependent variable is continuous. It models the relationship between variables using the least squares method. There are two main types:
- Simple linear regression – with one independent variable
- Multiple linear regression – with two or more independent variables
2. Logistic Regression Model
In contrast, this model is used when the dependent variable is categorical (e.g., true/false, yes/no, 1/0). It predicts the probability of class membership rather than a continuous value.
Thus, the key difference in linear regression vs logistic regression lies in the nature of the outcome variable and the method of estimation. While linear regression outputs continuous values, logistic regression models the probability of a class using a sigmoid/logit function.
Types of Logistic Regression
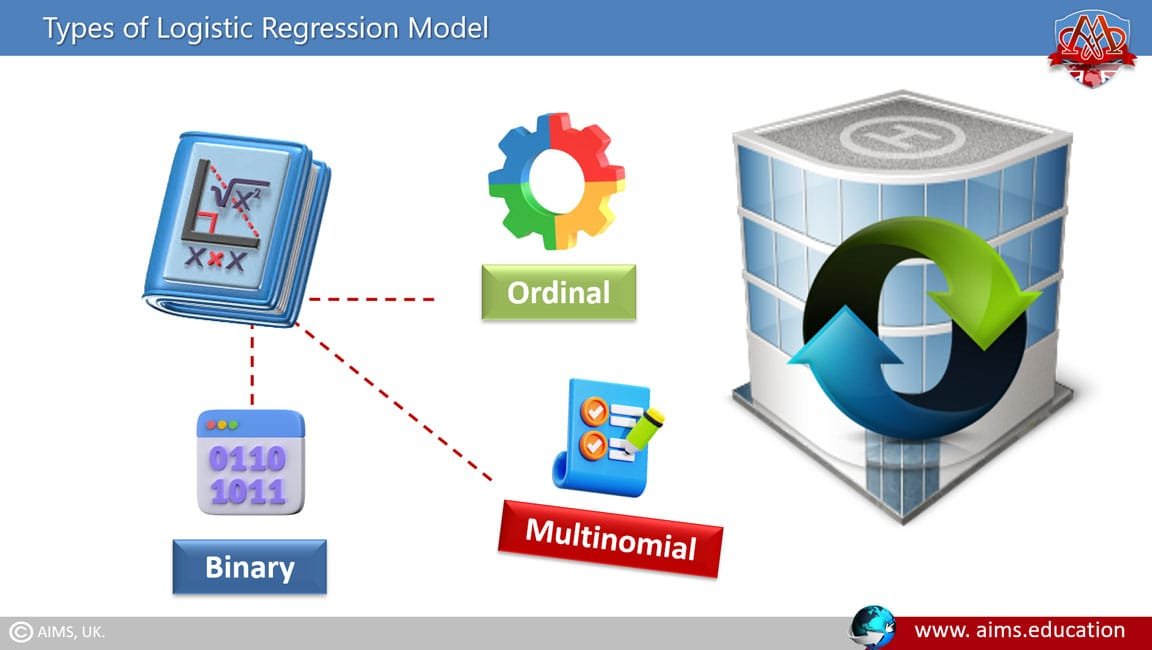
It can be categorized into three types, depending on the nature of the categorical dependent variable:
- Binary,
- Multinomial, and
- Ordinal.
Each type is used for a different kind of classification problem.
1. Binary Logistic Regression
This is the most common and widely used form, in which the dependent variable is binary, meaning it has only two possible outcomes, such as 0/1, yes/no, or true/false. It is a fundamental tool for solving binary classification problems.
Example
A logistics company predicts whether a package will be delivered on time.
- Dependent Variable: Delivery status (0 = Late, 1 = On Time)
- Independent Variables: Package weight (grams), Distance (km), Weather forecast (Clear or Bad)
This type of regression model is ideal for situations where the outcome is a simple success/failure decision.
2. Multinomial Logistic Regression
In this regression, the dependent variable can have three or more unordered categories. Unlike binary regression, these outcomes do not follow any specific order.
Example
A company needs to predict the most suitable mode of transport for package delivery.
- Dependent Variable: Transportation type (Air, Road, Ship)
- Independent Variables: Distance (km), Package size (Small, Medium, Large), Urgency (High or Low)
Multinomial logistic regression is useful in multiclass classification problems where the categories are mutually exclusive and unordered.
3. Ordinal Logistic Regression
Ordinal logistic regression is used when the dependent variable has three or more categories that follow a natural order, but the distances between categories are unknown or unequal.
Example
A company evaluates customer satisfaction based on delivery experiences.
- Dependent Variable: Customer satisfaction (Low, Medium, High)
- Independent Variables: Delivery time (hours), Shipment cost (Rs), Package condition (Intact or Damaged)
This type of regression is ideal for analyzing ordered categorical responses, such as ratings, satisfaction levels, or grading scales.
Applications of Logistic Regression
Logistic regression is widely used across various industries for predictive analysis involving binary or categorical outcomes. Below are its practical applications:
a. Logistic Regression in Manufacturing
The manufacturers use it to estimate the likelihood of machine part failures. This helps in planning preventive maintenance to avoid costly downtimes and improve operational efficiency.
b. Logistic Regression in Finance
Banks and insurance companies use it to:
- Assess loan or insurance application risk (e.g., high or low risk)
- Detect fraudulent financial transactions
These problems involve discrete classification, making it an effective modeling tool.
c. Logistic Regression in Marketing and Promotions
Online marketing platforms apply it to predict ad click-through rates. This enables marketers to optimize ad content based on user responses to different text, visuals, or targeting strategies.
Logistic Regression in Supply Chain Management
Courses like the AIMS’ online supply chain management diploma or MBA in Supply Chain & Logistics Management teach how logistic regression enhances operational decision-making in supply chain.
1. Predictive Performance in Logistics
a. Supplier Performance
Predicts the likelihood of delayed shipments based on past supplier data.
b. Product Return Probability
For better supply chain management processes, it estimates the chances of a product return using historical sales and customer behavior data.
c. Machine Maintenance Forecasting
Uses machine age, usage, and service records to predict machine failure probability.
2. Interpreting Logistic Regression Outcomes
By analyzing probabilities and odds ratios, logistics professionals can:
- Quantify the likelihood of events
- Make data-driven decisions to minimize uncertainty
3. The Power of Binary Outcomes
The binary nature of logistic regression offers clear, decisive outcomes (e.g., delay/no delay, defect/no defect), allowing businesses to act swiftly and with confidence.
4. Train Score in Logistic Regression
The train score measures how well a model fits its training dataset. Common metrics include:
a. Accuracy
Accuracy is the proportion of training dataset samples that were properly classified.
Accuracy = Number of correct predictions/Total number of predictions
b. Log-Loss
Measures how well predicted probabilities match actual outcomes.
Lower log-loss = better performance.
c. Additional Metrics
- F1-Score, Precision, Recall: Crucial for imbalanced datasets
- AUC-ROC: Measures the model’s ability to distinguish between classes
d. Overfitting vs. Underfitting
- Overfitting: High train score but poor test score—model learns noise, not general patterns
- Underfitting: Low train and test scores—model is too simple or undertrained
Best Practice: Ensure train and test scores are close for reliable generalization.
Key Advantages of Logistic Regression
It offers several benefits in machine learning and predictive analytics:
1. Easy to Implement
Machine learning models using logistic regression are easy to train and configure. During training, the model learns patterns in the input and links them to the expected output.
2. Ideal for Linearly Separable Data
When data can be separated by a straight line, logistic regression performs exceptionally well—especially for binary outcomes.
3. Provides Interpretability
Logistic regression provides clear insights into:
- Direction (+/-) of relationships between variables.
- Variable significance helps identify which factors matter most.
Frequently Asked Questions
Q1: What is logistic regression?
It predicts the probability of a binary outcome using a logit link on a linear combination of predictors, estimated via maximum likelihood.
Q2: What is the logistic regression formula?
logit(π) = ln(π/(1−π)) = β₀ + β₁x₁ + … + βₖxₖ, where π is the probability of the positive class and β are MLE-estimated coefficients.
Q3: How do I interpret coefficients?
Exponentiate a coefficient to get an odds ratio: values >1 increase odds of the positive class; values <1 decrease them, ceteris paribus.
Q4: What assumptions does logistic regression make?
Binary dependent variable, linearity in the logit, no severe multicollinearity, and absence of extreme outliers in continuous predictors.
Q5: How is the decision boundary defined?
With two predictors, the 0.5 threshold yields β₀ + β₁x₁ + β₂x₂ = 0; it can be linear or nonlinear depending on features.
Q6: How does it differ from linear regression?
Linear regression predicts continuous values; logistic regression models class probabilities for categorical outcomes using a sigmoid/logit.
Q7: What types of logistic regression exist?
Binary, multinomial (unordered), and ordinal (ordered) depending on the nature of the dependent variable.
Q8: How is it used in supply chain?
To predict on-time delivery, supplier delays, product returns, and machine failures to guide planning and reduce costs.
Q9: Which evaluation metrics should I use?
Accuracy, log-loss, precision, recall, F1-score, and AUC-ROC; compare train vs test to detect overfitting.
Q10: How do I choose a classification threshold?
Start at 0.5 and adjust based on business costs and precision–recall or ROC analysis to balance errors.
Q11: Can I include categorical predictors?
Yes—use dummy/one-hot encoding or contrasts to estimate effects relative to a reference category.
Q12: When is logistic regression the right choice?
When the outcome is categorical, logit relationships are roughly linear, and you value interpretability and efficiency.
