What is a Network Diagram Project Management?
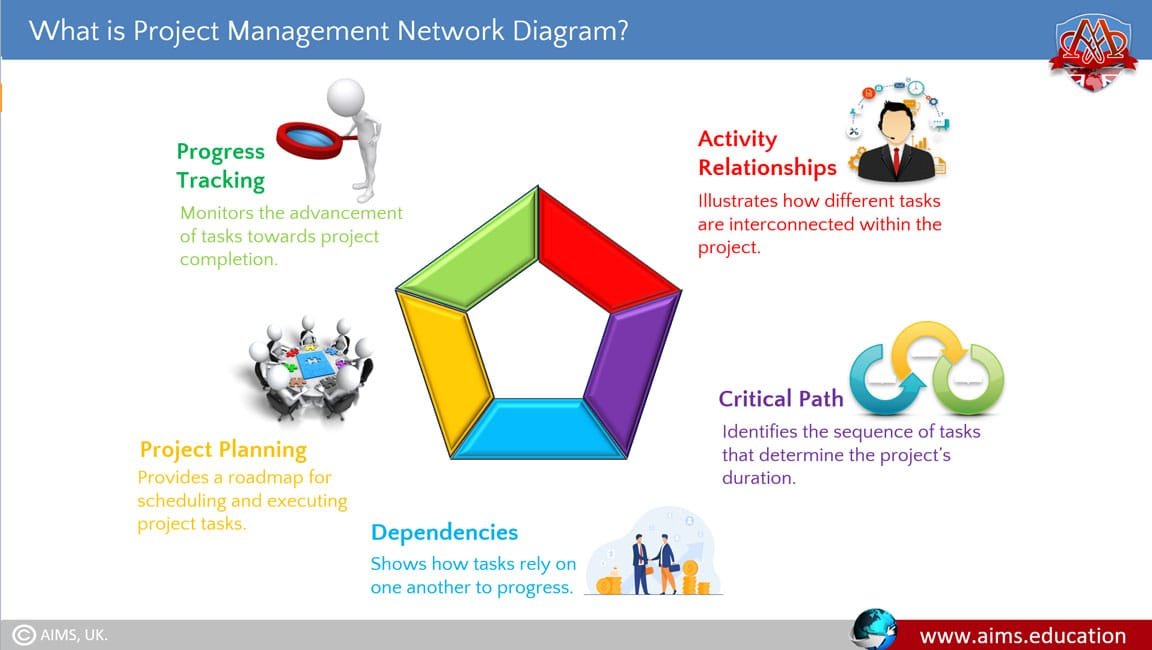
A network diagram project management is a graphical illustration showing the logical and chronological relationships between various project activities, exemplifying the sequence of activities, the critical path, and dependencies to help plan and ensure success in project execution. A project management network diagram helps project managers ascertain the sequence of activity occurrences and identify the critical path.
- Typically, it is shown as a chart with arrows (lines) and boxes (nodes), used to plan the project schedule and work sequence, as well as track its progress at each step until completion.
- Network diagram in project management is the core of a project because it encompasses all the activities that must be completed.

4 Key Elements of a Network Diagram in Project Management
The following are the four basic components of a network diagram in project management:
1. Boxes (Nodes)
Each box represents a project task and contains information about the task, such as name, duration, resources, and other relevant details
2. Arrows (Lines)
Arrows indicate the dependencies between tasks and the logical sequence of task occurrence. The direction of the arrow shows the flow of work.
3. Relationships
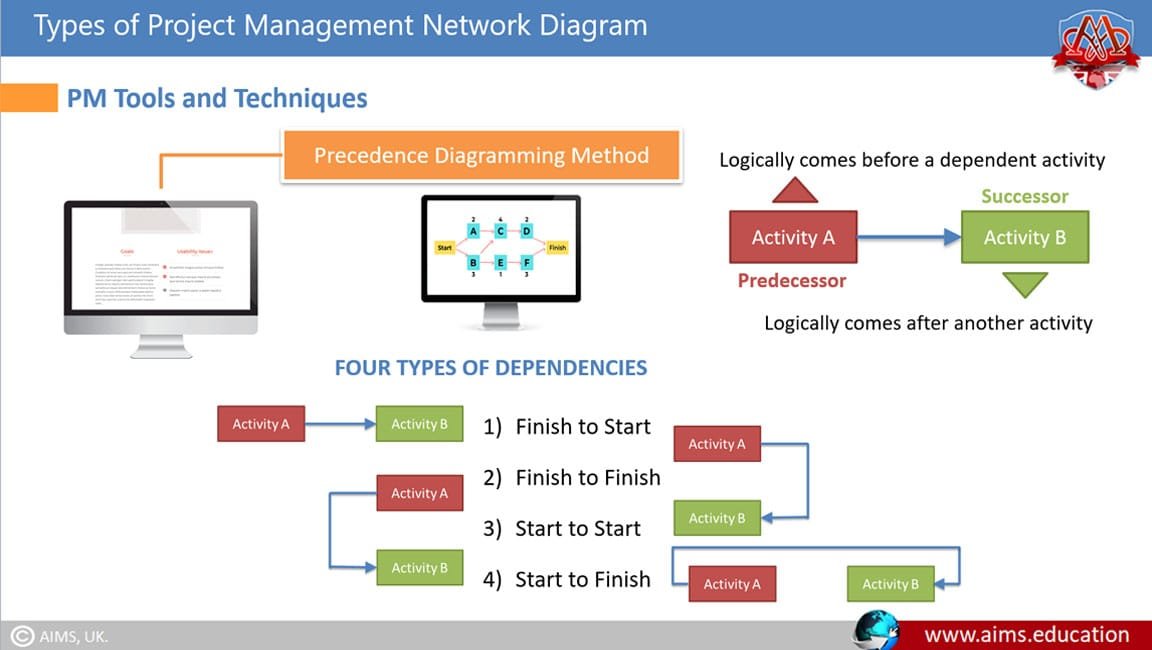
There are four types of relationships among tasks in network diagram project management:
- Finish-to-Start (FS): The successor task cannot start until the predecessor task ends.
- Start-to-Start (SS): The successor task cannot start until the predecessor task starts.
- Finish-to-Finish (FF): The successor task cannot finish until the predecessor task finishes.
- Start-to-Finish (SF): The successor task cannot finish until the predecessor task starts.
4. The Critical Path
The critical path is the longest sequence of dependent tasks that determines the shortest possible time for project completion .Tasks on the critical path have zero float time, meaning any delay in these tasks will delay the entire project.
Types of Network Diagrams in Project Management
There are two major types of network diagrams in project management: Arrow Diagramming Method (ADM) and Precedence Diagramming Method (PDM).
1. Arrow Diagramming Method (ADM)
Also known as the activity-on-arrow method, ADM uses arrows to represent activities in a project. In ADM:
- The arrow tail indicates the start, and the arrowhead indicates the end of a task.
- The length of the arrow represents the task’s duration.
- Each arrow represents a connection between two boxes (nodes), specifically the ‘i-node’ (start) and the ‘j-node’ (end) of a task.
- It only illustrates the Finish-to-Start (FS) relationship between tasks.
Objectives of ADM
- Visualize the critical path.
- Recognize project constraints.
- Assist in project scheduling and resource allocation by identifying project tasks and their dependencies upfront.
Advantages of ADM
The advantages of ADM in project management network diagram includes the following:
- It is simple to create and understand.
- It helps track the project schedule effectively.
- It supports ‘what-if’ analysis to evaluate different scenarios.

2. Precedence Diagramming Method (PDM)
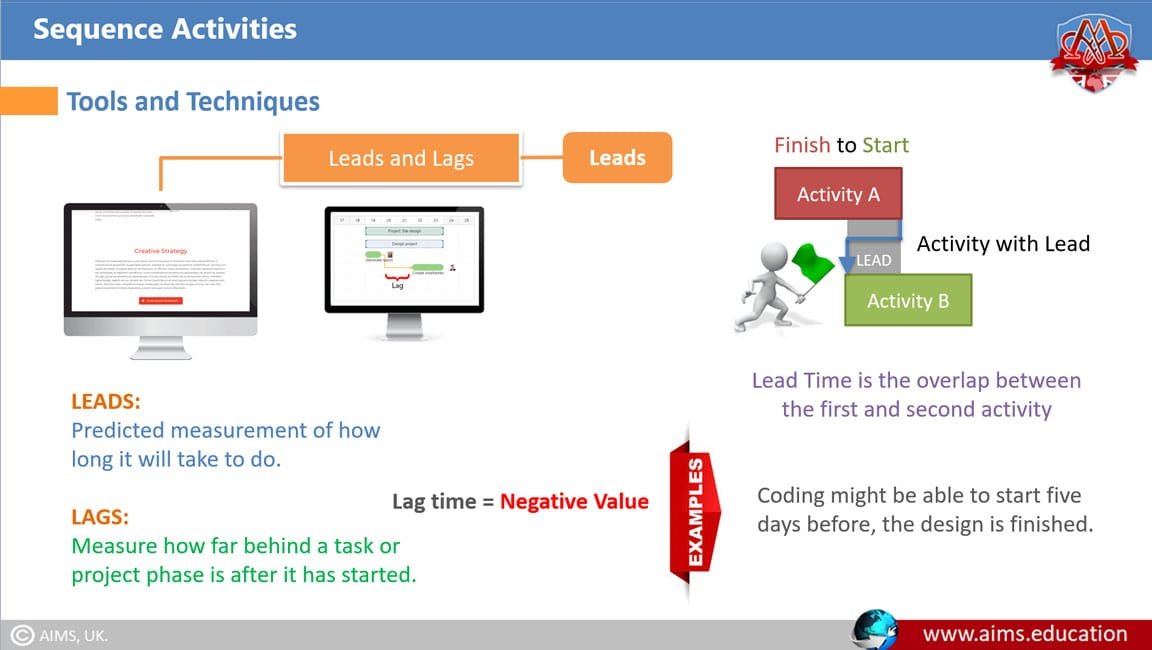
Also known as node network or activity-on-the-node, PDM is commonly used for more complex and specialized projects. In PDM, each box represents a task, and arrows show the relationships between tasks. PDM allows for all four types of relationships: FS, SS, FF, and SF. In addition, lag and lead time can be added to the arrows. For example, if a task requires 15 days to complete before the next task can begin, it will be indicated as “15 days” over the arrow connecting the tasks.
Advantages of PDM
The advantages of PDM include:
- Efficient planning through clear representation of relationships and dependencies.
- Helps identify missing activities.
- Aids in recognizing and prioritizing critical tasks.
- Enables the evaluation of alternatives.
- Facilitates sharing project timelines with team members and stakeholders.
- Improves overall project management effectiveness.
How to Create a Network Diagram in Project Management
Before creating a network diagram, it is important to understand the task sequence and their start and end points in the project. The following steps can help create an effective diagram:
Step-1: Design a Predecessor Chart for the Project Network Diagram
Start by creating a predecessor chart that outlines the order of project activities. List each activity along with its dependencies, identifying tasks that must be completed before the next task can begin. This chart forms the basis for constructing the project network diagram.
Step-2: Identify the Tasks for the Project Network Diagram
Before drafting the network diagram, write down all essential tasks and their dependencies. A Work Breakdown Structure (WBS) helps break the project into stages. Once completed, start designing the network diagram and identify the critical path.
Step-3: Create a Rough Draft of the Project Network Diagram
After organizing the tasks and dependencies, draft a rough network diagram. Rearrange and remove any unnecessary elements to ensure the diagram is clear, simple, and readable.
Network diagram project management is a essential part of educational courses offered by AIMS’ Institute of Project Management. These courses include the Certified Project Manager or CPM Certification, an online Diploma in Project Management, and an online Masters Degree in Project Management.

Project Management Network Diagram: A Serving Tool for Project Managers
A network diagram in project management is a valuable tool for project managers to plan, execute, and track projects within the desired timeframe. It serves project managers in the following ways:
1.Identify the Sequence of Activities
It provides a clear picture of tasks that should be executed smoothly from one to the next.
2. Identify Task Dependencies
The network diagram helps project managers effectively identify task dependencies, ensuring tasks are completed in the right order.
3. Establish the Critical Path
By visualizing tasks on charts or graphs, project managers can establish the critical path and manage tasks to ensure proper project time management.
4. Define the Project Timeline
The diagram shows the task sequence and dependencies, helping project managers accurately estimate the project timeline and potential delays.
5. Assign Resources
It allows project managers to allocate resources based on the task flow, ensuring resources are available when needed.
Advantages and Disadvantages of Project Management Network Diagram
Benefits of the Network Diagram in Project Management
A project management network diagram offers many advantages:
1. Clear Visualization of Project Tasks
It provides a visual representation of tasks, dependencies, and the critical path, ensuring that project team members understand the workflow and structure.
2. Planning Sequence of Activities
The diagram helps plan activities in the correct order, reducing delays and improving efficiency.
3. Defining Task Dependencies
It helps identify and manage task dependencies, minimizing bottlenecks and delays.
4. Critical Path Analysis
Project managers can analyze and manage tasks on the critical path to ensure timely project completion.
5. Resource Allocation
The diagram aids in allocating resources by providing an overview of task dependencies and timelines.
6. Risk Identification
The network diagram allows project managers to identify project risks by highlighting critical paths and task dependencies.
7. Communication Tool
It serves as a communication tool, enabling project managers to share project plans, timelines, and dependencies with team members, stakeholders, and clients.
Drawbacks of the Network Diagram in Project Management
Despite its many benefits, the network diagram method has some drawbacks:
- It can be an expensive method to implement.
- When there are too many tasks, the diagram can become difficult to understand.
- There is a risk of errors during the diagram creation process.
- The diagram can be misinterpreted, leading to significant project execution errors.
- It is sensitive to external factors, which can affect the accuracy of the diagram.
Frequently Asked Questions
Q1: What is a network diagram in project management?
A network diagram is a graphical representation of project activities and their dependencies, helping managers plan, schedule, and monitor efficiently.
Q2: What are the key elements of a project network diagram?
The core elements are boxes (nodes), arrows (lines), task relationships, and the critical path that defines project duration.
Q3: How does a network diagram help in project planning?
It visualises dependencies, identifies the critical path, and helps project managers allocate resources effectively to minimise risk and delay.
Q4: What are the main types of network diagrams?
The two main types are ADM (Activity on Arrow) and PDM (Activity on Node), differing in how they depict tasks and relationships.
Q5: What is the critical path in a network diagram?
The critical path is the longest dependent task sequence determining the project’s minimum completion time.
Q6: How can I create a project network diagram?
List tasks and dependencies, build a predecessor chart, and draw the network showing relationships clearly to identify the critical path.
Q7: What are the advantages of using network diagrams?
They improve project visibility, enhance planning accuracy, and strengthen team communication and coordination.
Q8: Are there disadvantages to using network diagrams?
Complex diagrams can be hard to manage and prone to errors, especially when projects involve numerous interdependent tasks.
Q9: What is the difference between ADM and PDM?
ADM uses arrows to represent tasks (Finish-to-Start only), while PDM uses nodes and supports all relationship types like FS, SS, FF, and SF.
Q10: Why is understanding network diagrams important in project management education?
It builds analytical and planning skills essential for professional certifications and advanced project management studies at AIMS.
